Can DoPricer CPQ improve deal to quote efficiency?
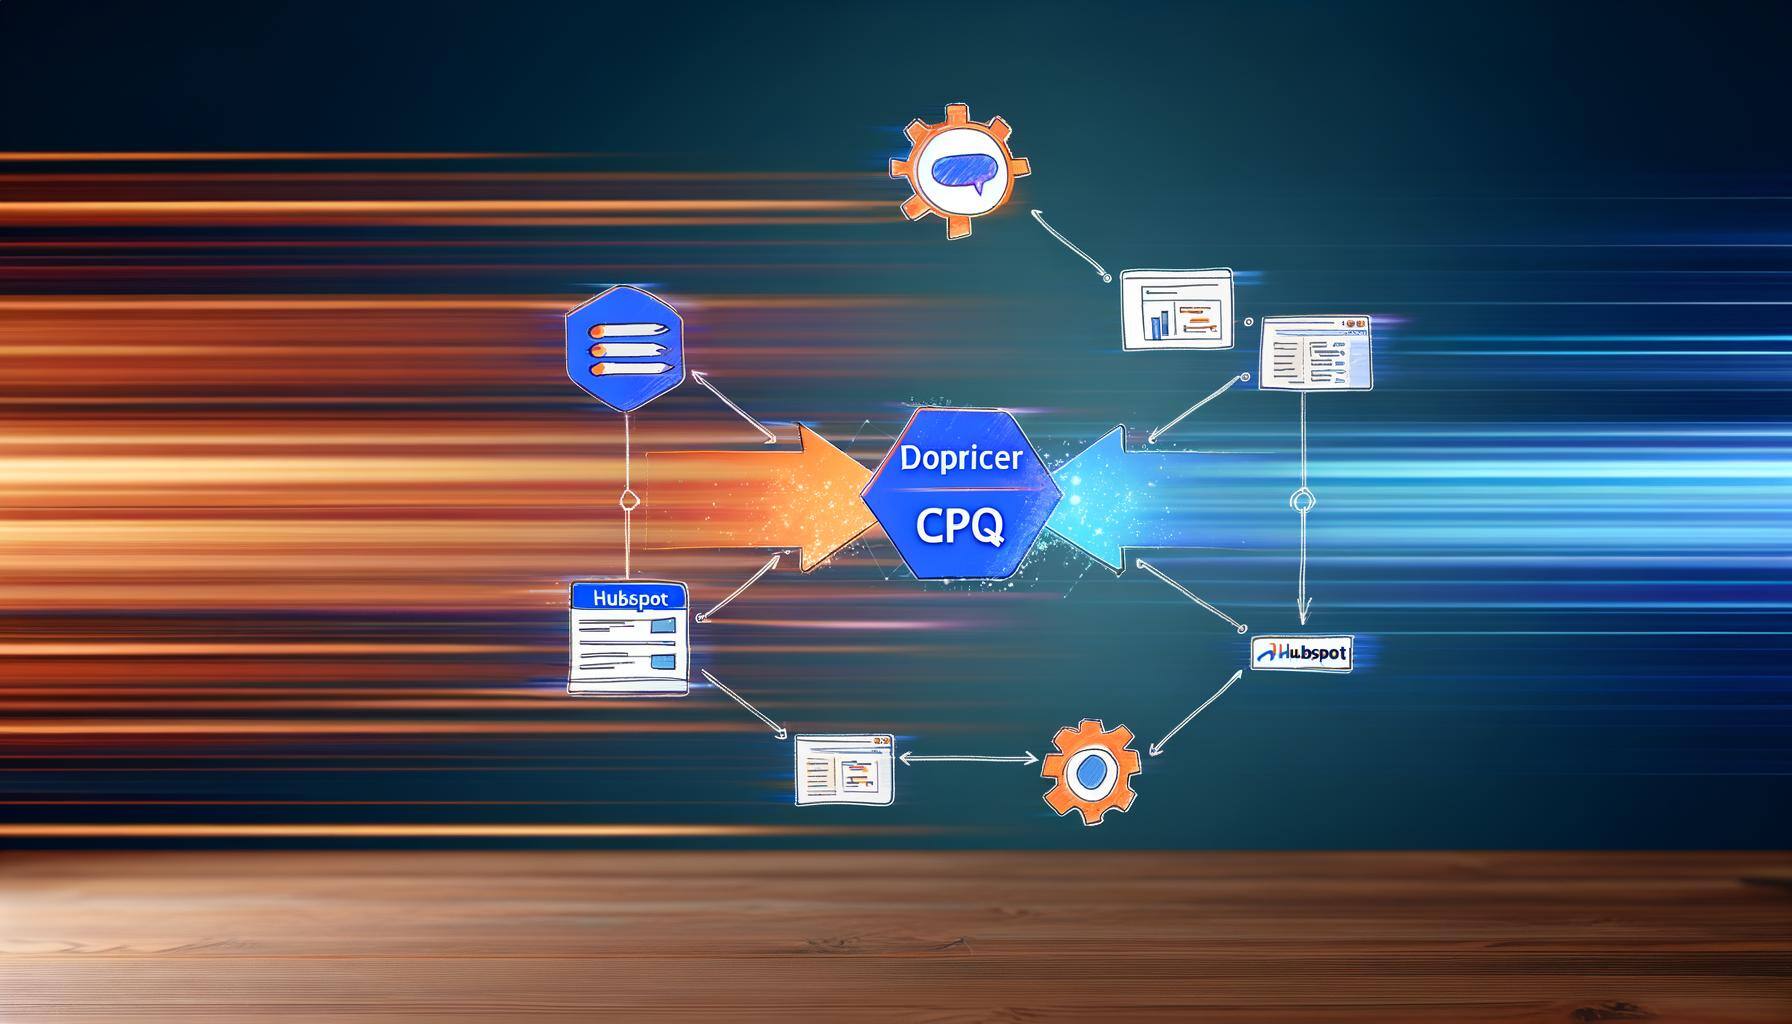
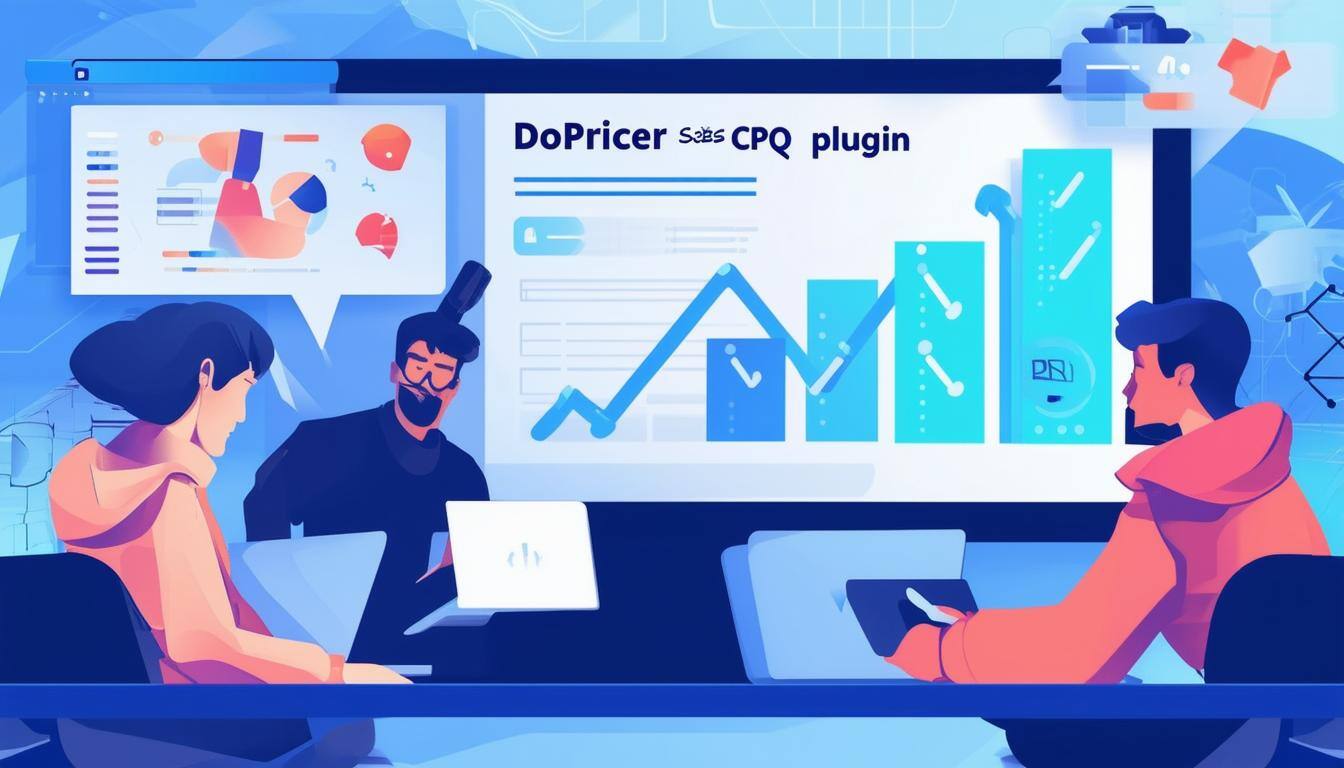
DoPricer CPQ (Configure, Price, Quote) is a powerful HubSpot plugin, to streamline and optimise the...
Read the latest news about new Plugins, Apps for HubSpot and cool tools to streamline your currency and quoting in HubSpot.
DoPricer CPQ (Configure, Price, Quote) is a powerful HubSpot plugin, to streamline and optimise the...
Are you grappling with slow and error-prone quote generation in HubSpot? DoPricer is here to...
The manual process of generating quotes can be a significant bottleneck in your sales workflow,...
Reducing friction and frustration is key to maintaining a smooth workflow and ensuring customer...
In the fast-paced world of sales, time is of the essence, and a swift quoting process can make all...
Parth Ruparelia and Tracy Graziani share the real story of how Tracy increased...
Partnerstack Senior Channel Partner Manager Negar Nikaeein shares her experiences...

Kixie’s Head of Sales David Gable shares insightful examples of how he creates...

Databox VP of Customer Success Billy MacDonald shares his top tips from years of...